After weeks of development with a lot of brainpower being invested we have finally finished the first stable release of our Graphite integration into Icinga Web 2. The new features include a searchable graphs dashboard, multi-client capability and much more – read on.
Thanks to all contributors: Alexander, Blerim, Eric, Florian, Johannes, Markus, Michael and Thomas, you have done an awesome job!
Also many thanks to Deutsche Telekom for sponsoring the development!
Multi-client capability
The Graphite module now links all Graphite metrics with the hosts/services which provide them. If you aren’t allowed to see a host/service in Icinga Web 2’s frontend (monitoring module), you also won’t see its metrics and graphs. This makes the lives of admins of multi-customer Icinga Web instances easier.
Searchable graphs dashboard
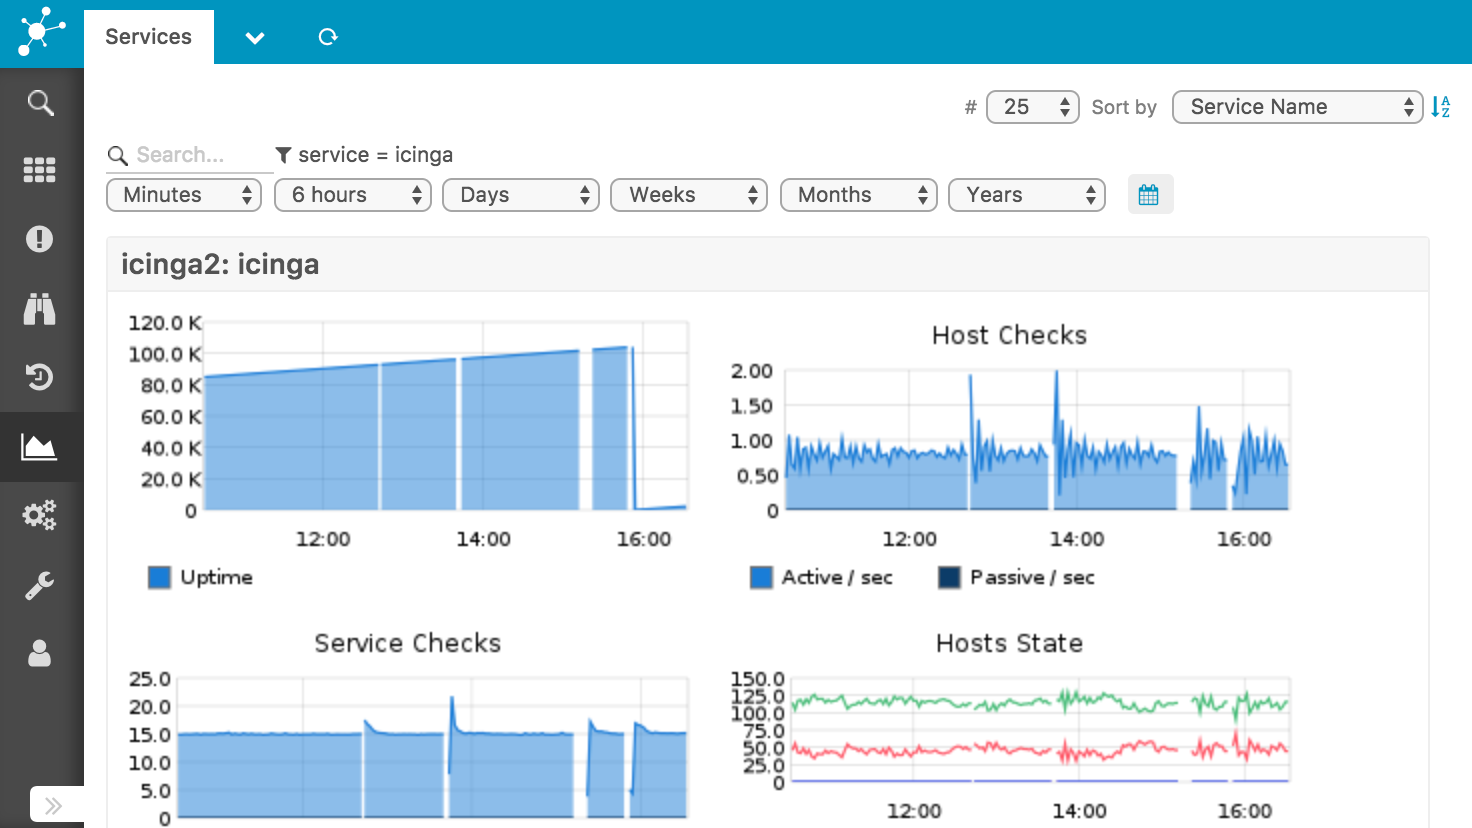
There are dashboards (sidebar > Graphite > Hosts/Services) with all graphs the user can see grouped by hosts/services. You may filter and search concrete hosts/services and sort by their properties like in the monitoring module’s list views. There’s also a picker for the time range to show data for.
Once that list view has been customized by these controls, it can be added to an Icinga Web 2 dashboard – again like the monitoring module’s list views.
Detail view extension
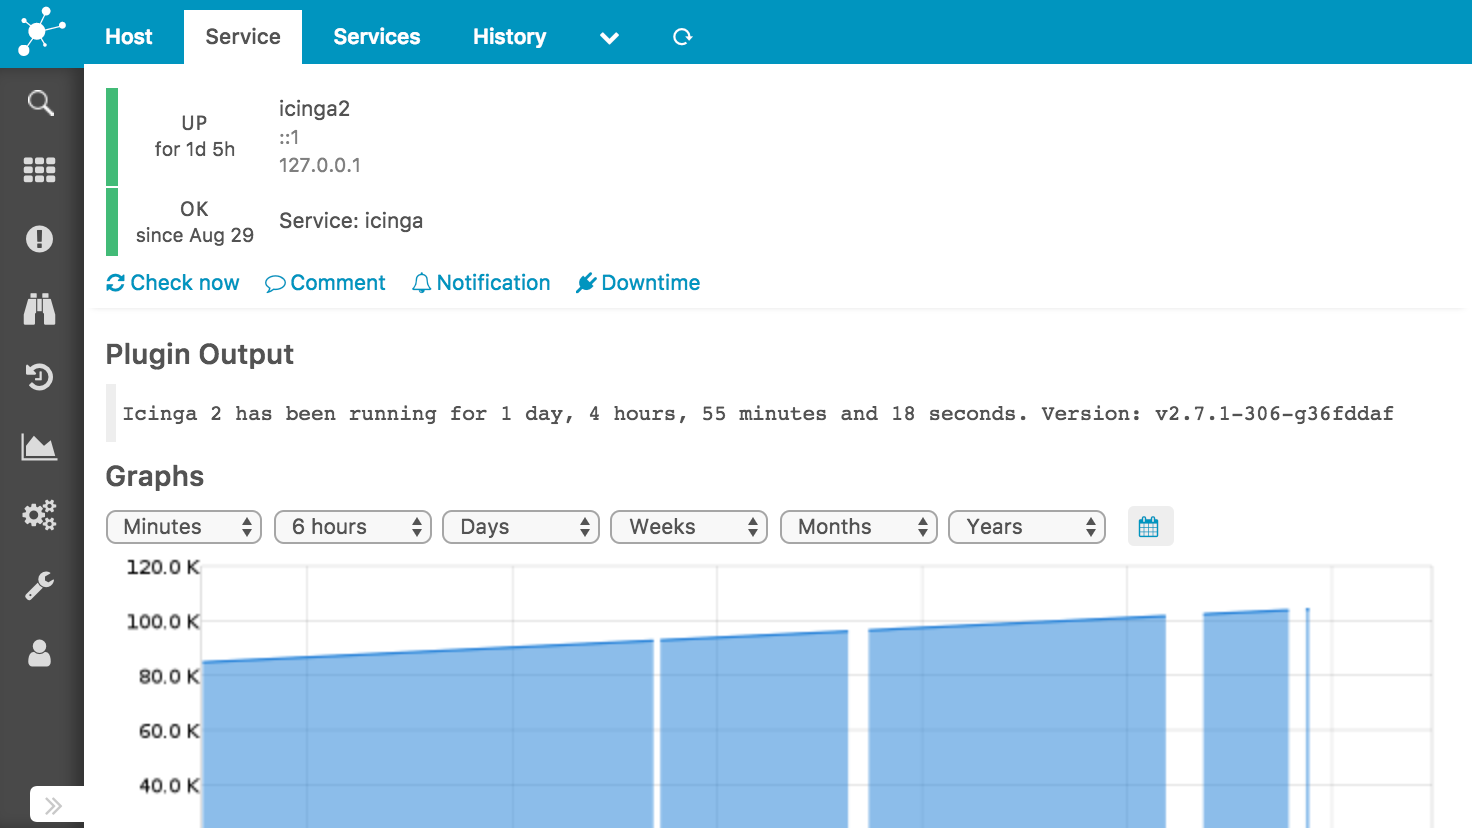
The Graphite module extends every host’s and service’s detail view by its graphs. There’s also the same time range picker as in the list views. By default only two graphs are shown, but you can click on “Show more” if you wish.
New template language
Example (disk):
[disk.graph]
check_command = "disk, disk-windows"
[disk.metrics_filters]
value = "$service_name_template$.perfdata.$disk$.value"
max = "$service_name_template$.perfdata.$disk$.max"
[disk.urlparams]
areaAlpha = "0.5"
areaMode = "all"
lineWidth = "2"
min = "0"
title = "Disk $disk$"
yUnitSystem = "binary"
[disk.functions]
value = "alias(color($metric$, '#1a7dd7'), 'Used (bytes)')"
max = "alias(color($metric$, '#cfd7e6'), 'Size (bytes)')"
The graph templates are written in the INI-Format. One .ini-file may contain one or more templates and one template (usually) consists of four sections starting with the template name followed by a dot. They specify fundamental graph parameters like the check commands the template applies to, the metrics to include in a graph, additional URL parameters to pass to Graphite Web and the legends.
For a detailed specification read the fine manual.
Multiple check commands
If some check commands do effectively the same thing or output the same kind of perfdata (like these ones), it makes sense combine them into one template instead of copying and pasting.
Dynamic metrics filters
If a check command observes multiple “service elements” (e.g. disk partitions, NICs, MySQL DBs), the template should be written dynamically enough to cover each possible “service element” identifier. A such template will generate one graph per $disk$. These variables may also be reused in the URL parameters e.g. to label the graphs according to what they represent.
Ready?
Start with the installation and continue with the configuration.
If you discover any bugs or have any feature requests, please report them to our official issue tracker.
If you have written any templates we don’t ship yet, please contribute them to the project.
Enjoy this release as much as we do!